Passionate about how data storytelling, geographic information systems (GIS), and design can help us address climate change in an equitable and community-centered way, I study data science and geography with a certificate in geographic artificial intelligence at the University of Florida. Whether it’s designing maps, visualizing data, or building apps, I love to embrace creativity in everything I do. I am passionate about geospatial data science and technology for social good because of the endless opportunities to build connections and share stories.
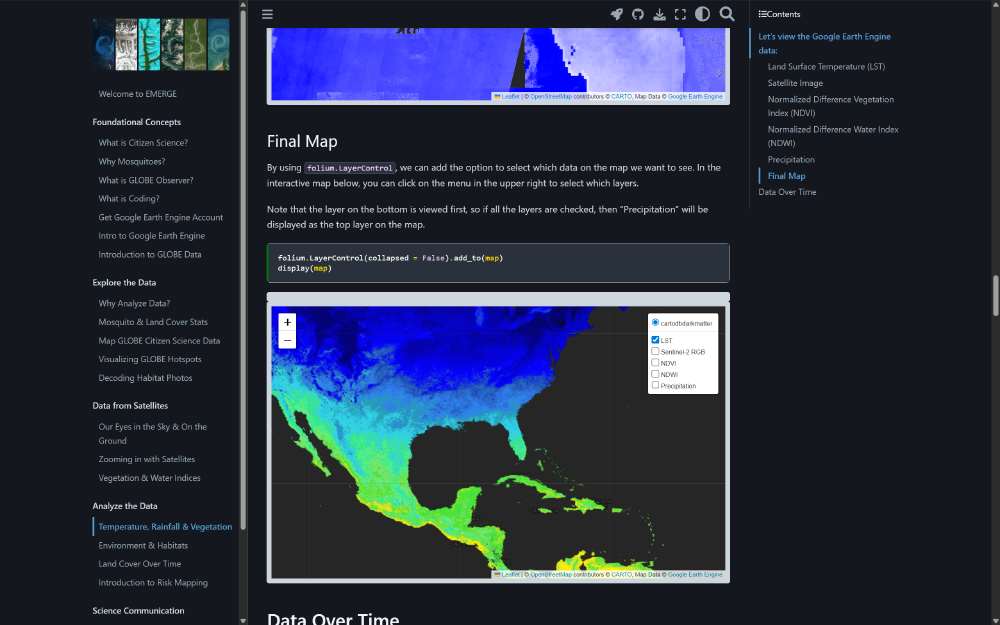
Co-created a digital textbook that includes coding tutorials, showing how to process and analyze environmental & community science data using Python and Google Earth Engine. [Geospatial Digital Informatics Lab at the Unviersity of Florida]
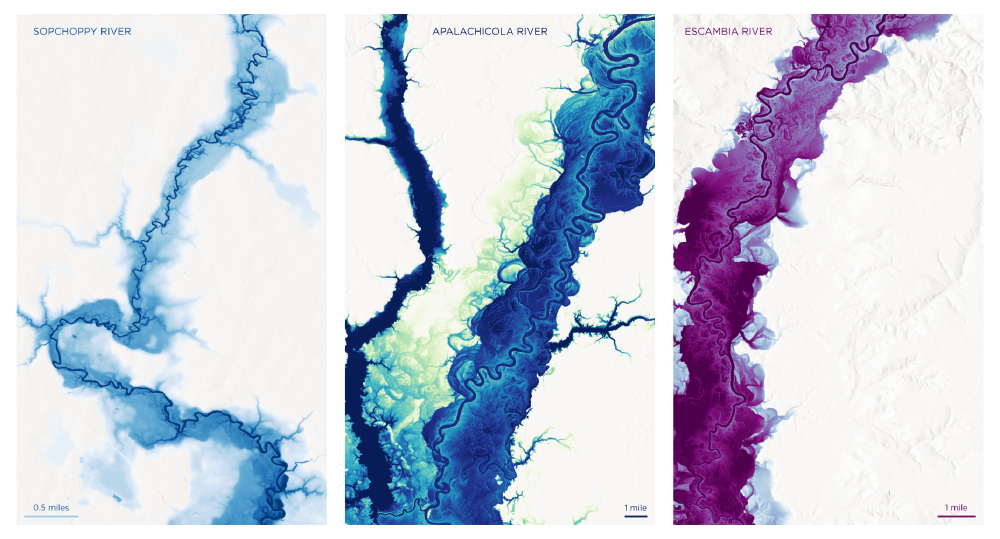
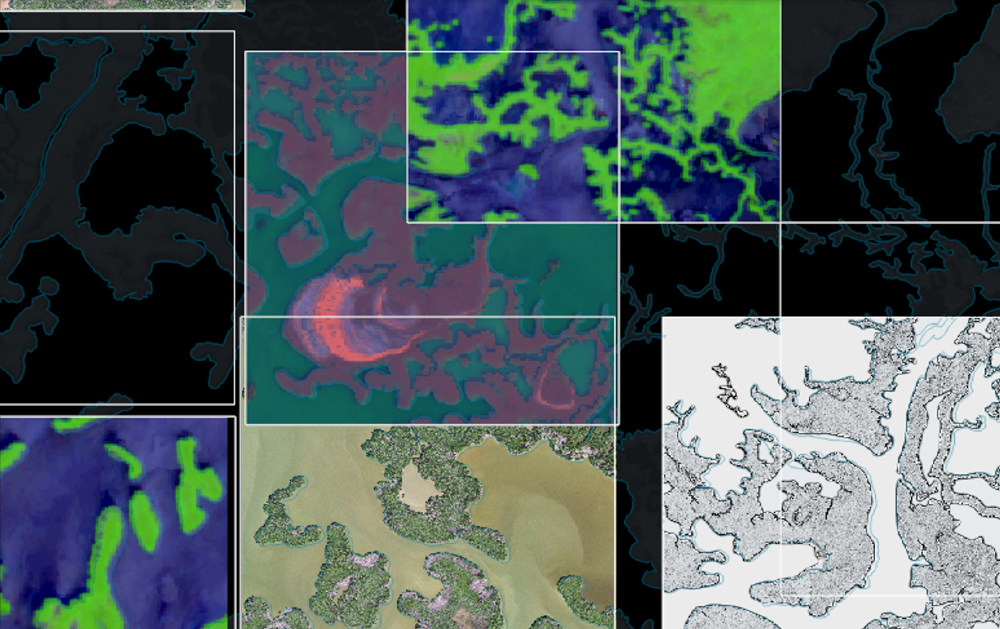
A gallery of various maps I have made.
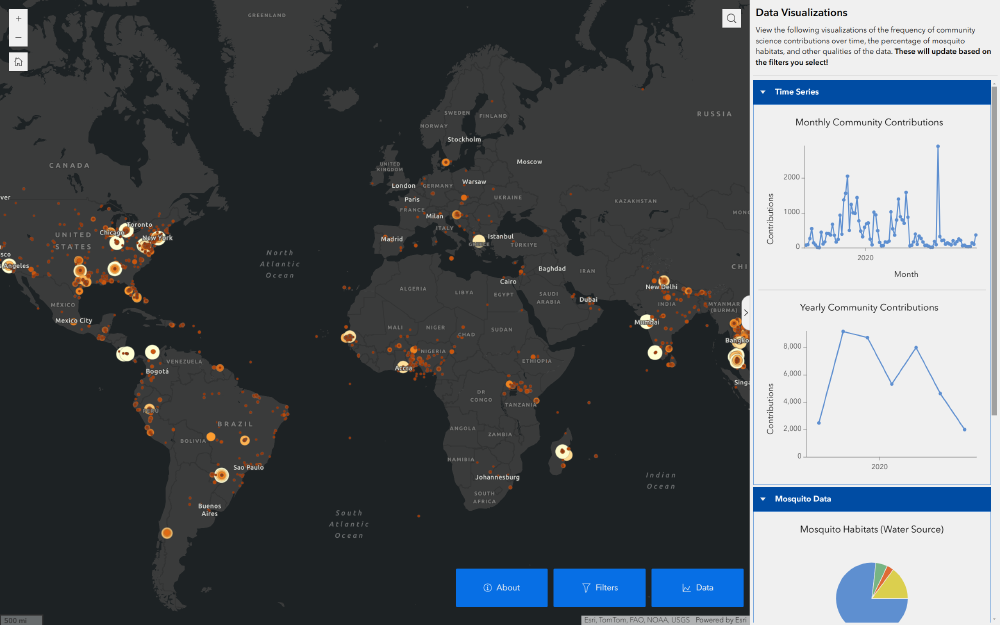
I created this dashboard to visualize community science data (collected by people around the world) about mosquito habitats. [Geospatial Digital Informatics Lab at the Unviersity of Florida]
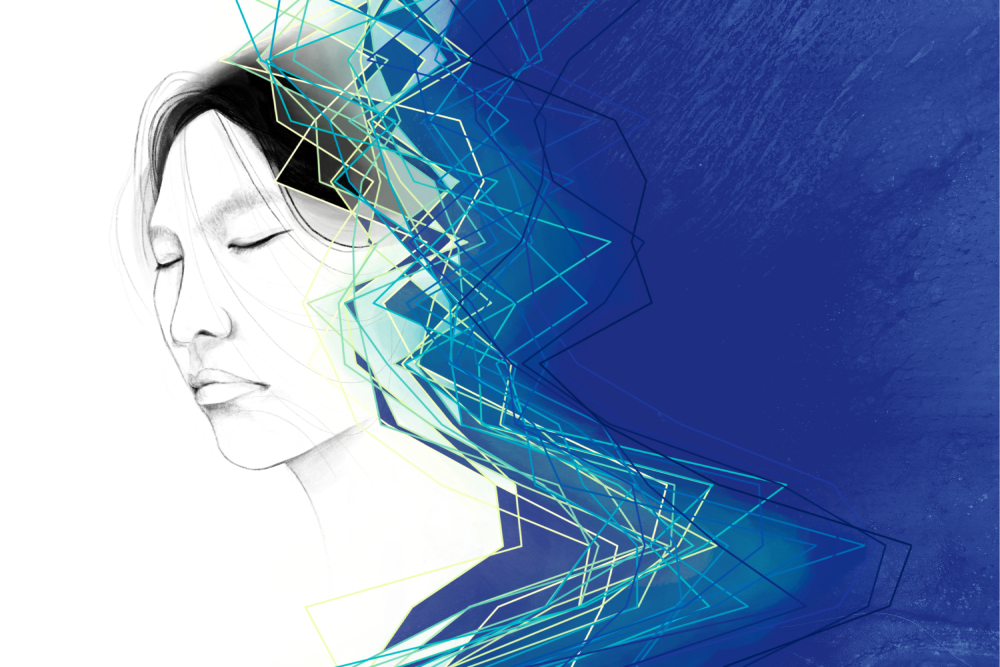
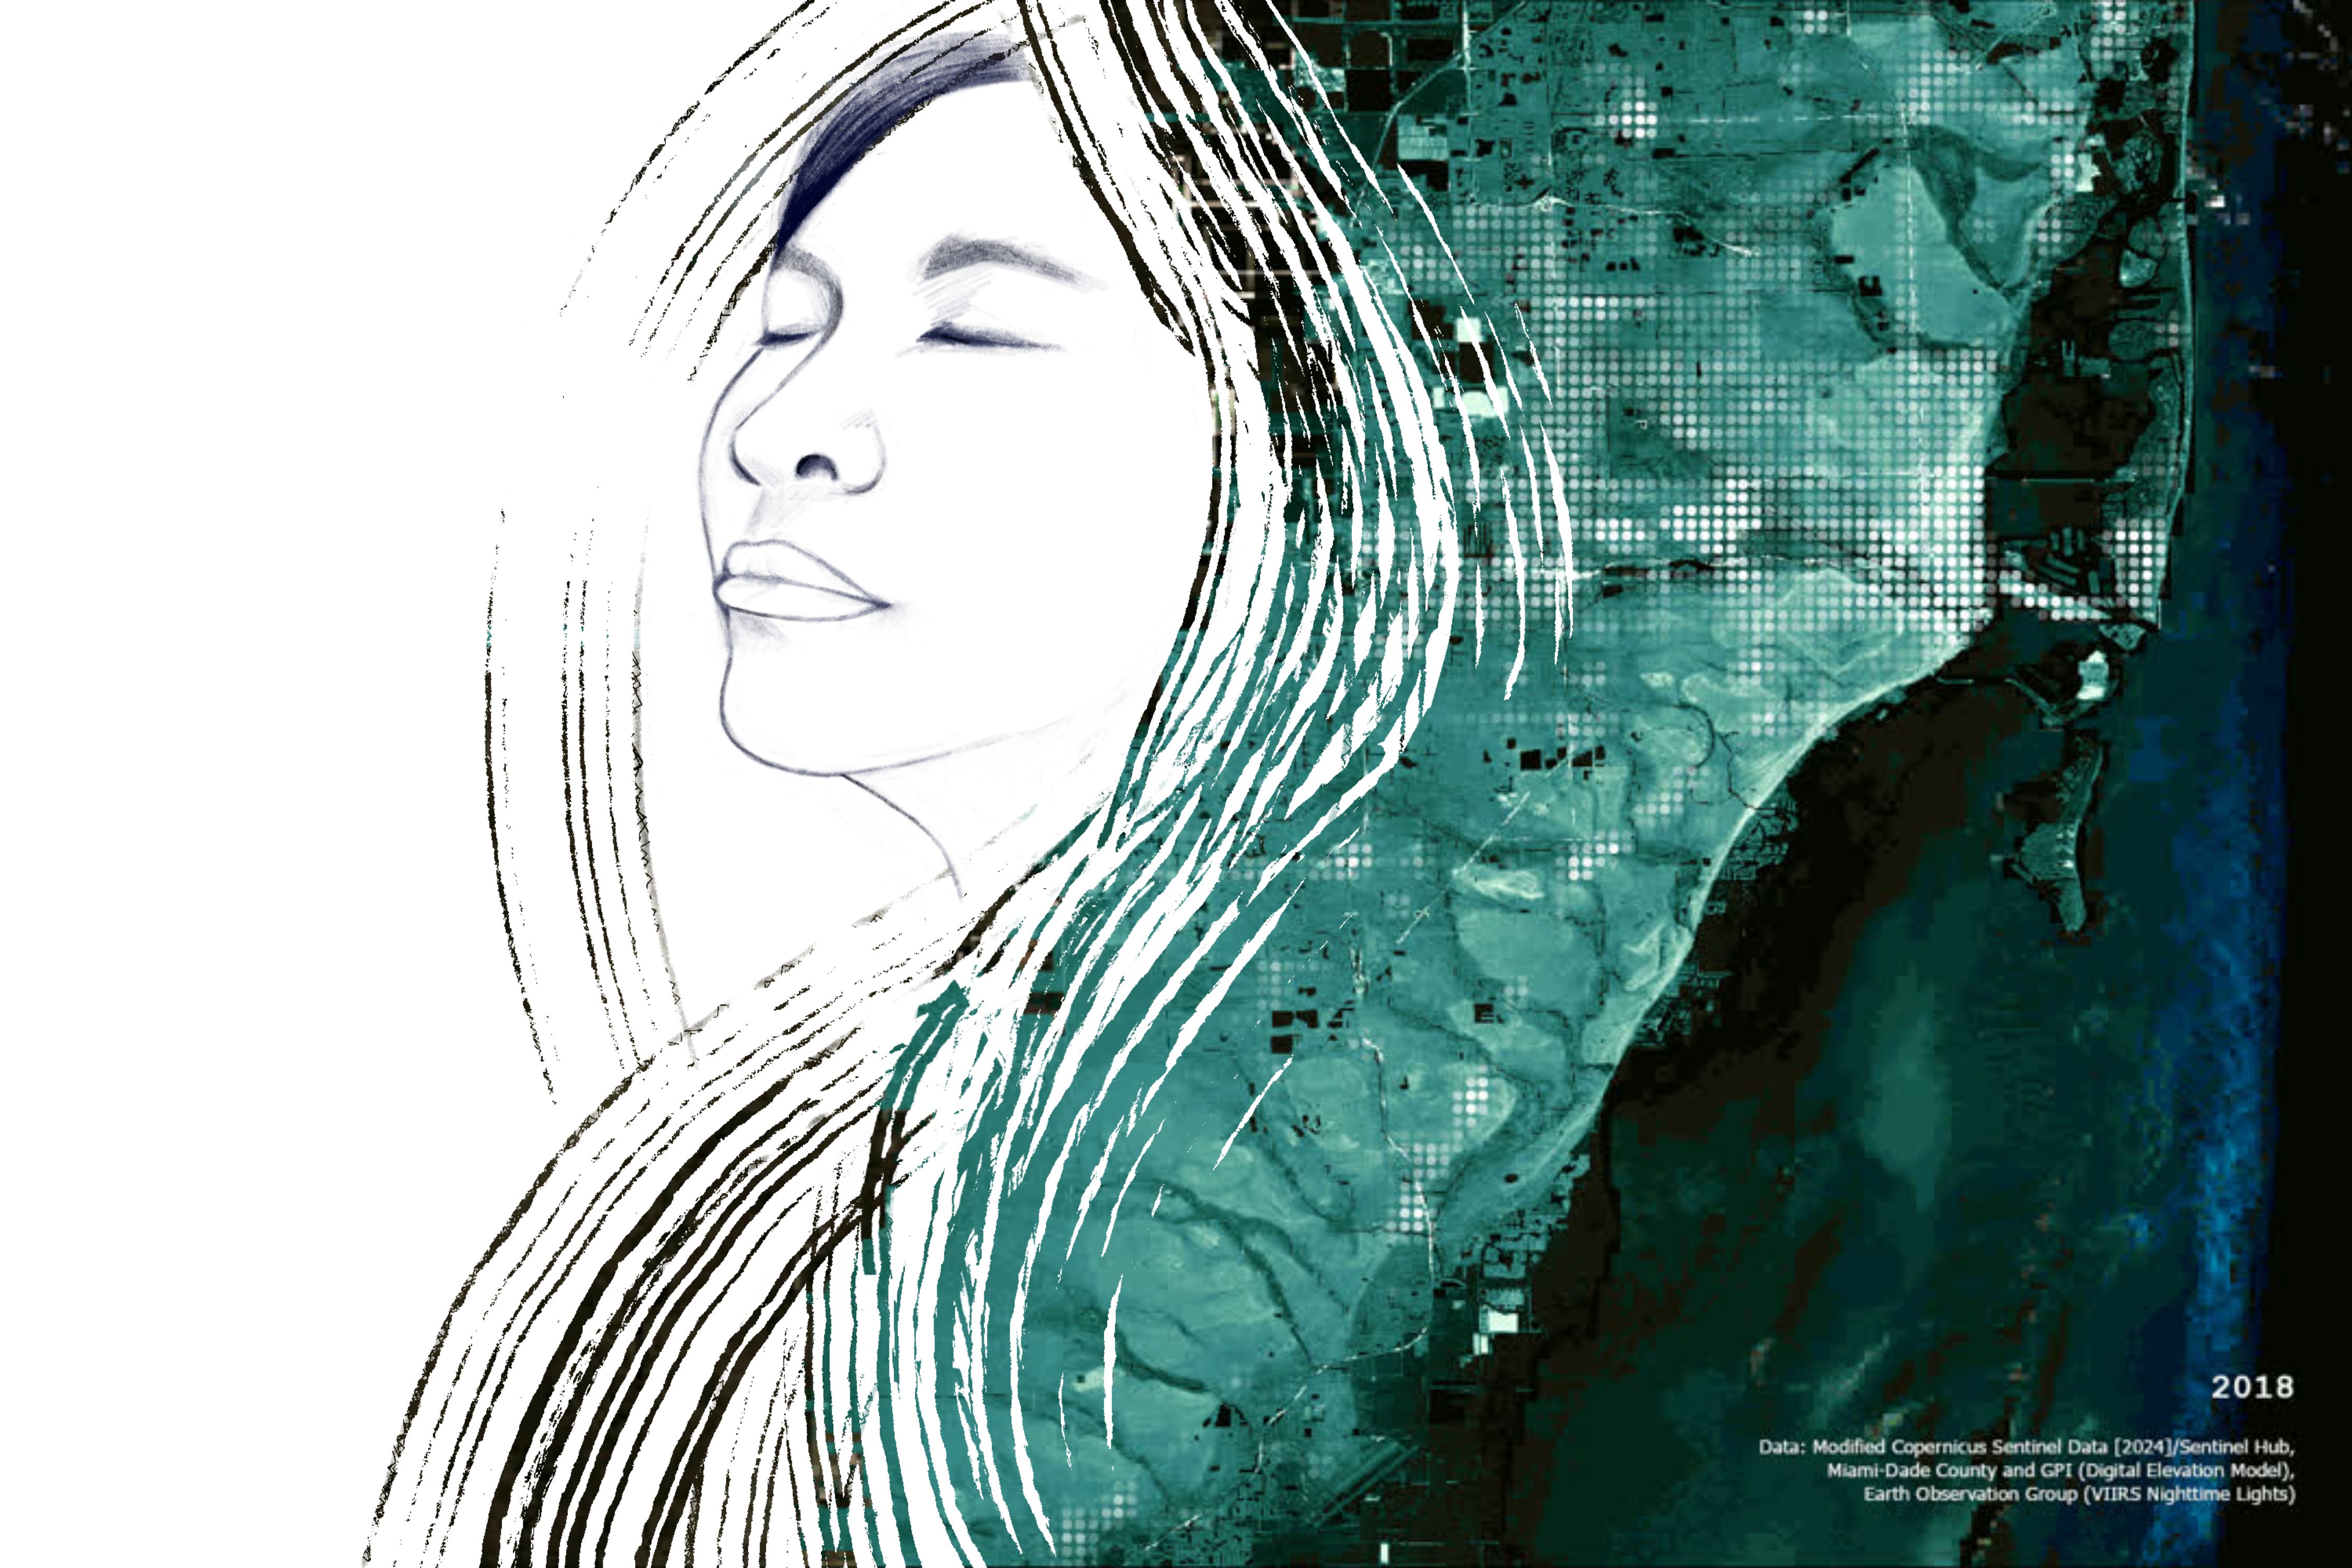
Featuring a timelapse of projected flooding from sea level rise up to 10 feet in South Florida, a graph of sea levels (1994-2023) off the coast of Southeast Florida, and a personal portrait, this artwork explores data visualization as an avenue for climate storytelling. “Over the Years” was on display in Queens, New York at the Queens Council on the Arts in partnership with Ofrenda Fest from September to December 2024.
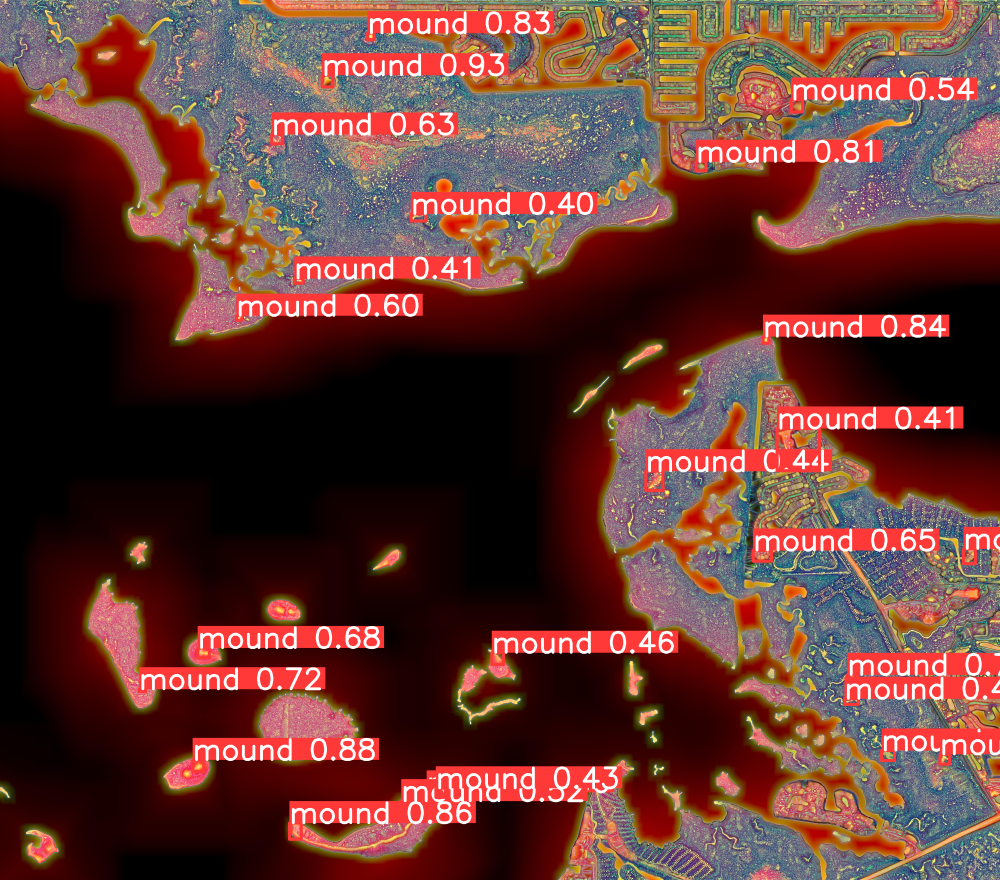
I worked on a research project to detect archaeological shell mound sites using open-source object detection models and presented our results at the 2024 American Anthropological Association Annual Meeting. [AI for Bio/Cultural Diversity Lab at the Florida Museum of Natural History]
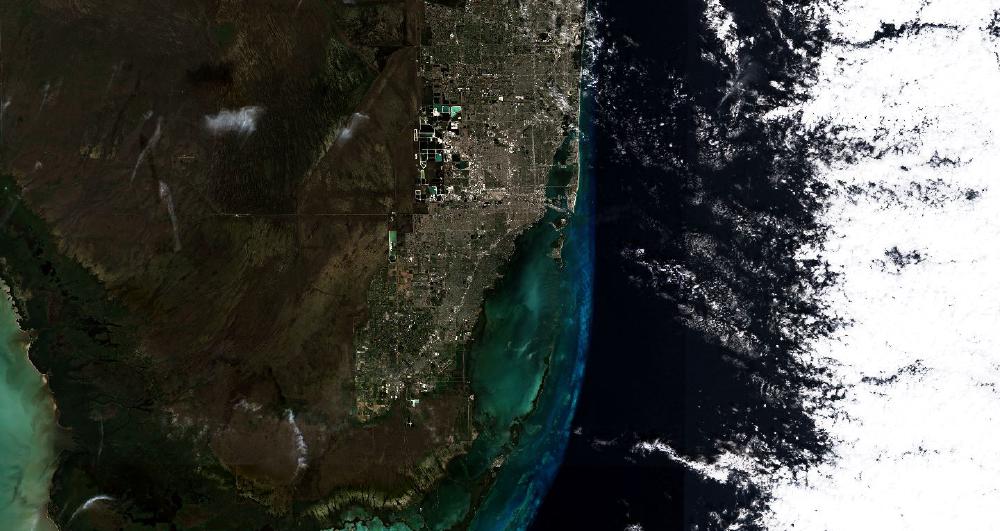
I created this Story Map about sea level rise in Miami. [Florida Community Innovation]
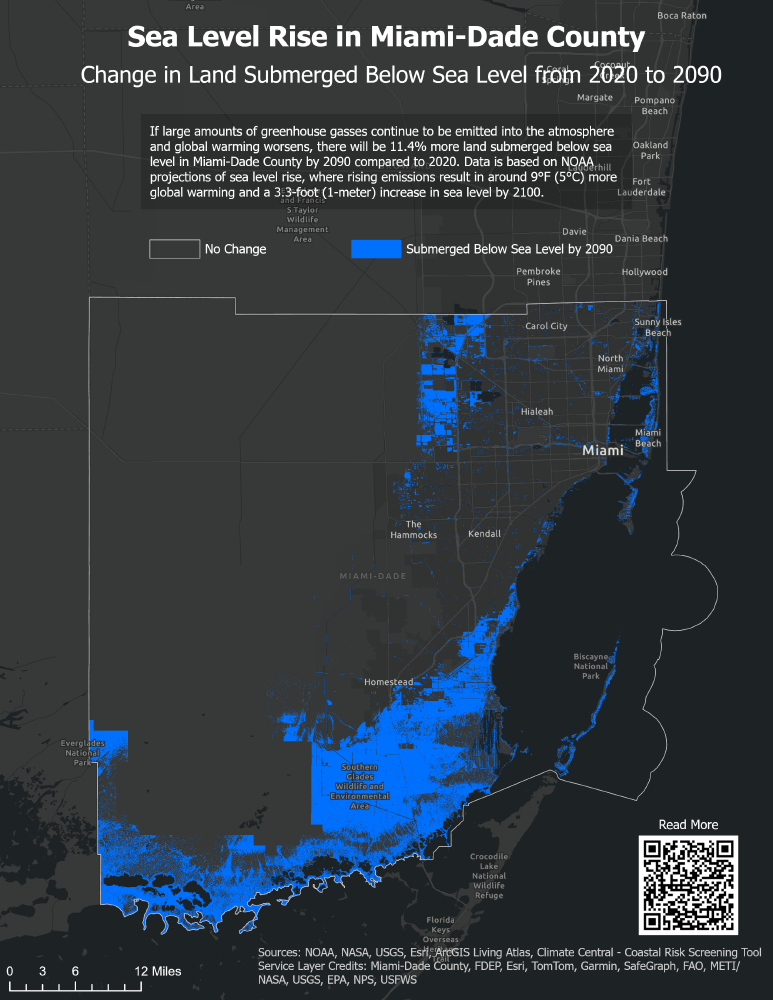
By 2090, there will be 11.4% more land submerged below sea level in Miami-Dade County compared to 2020. Florida Community Innovation hosted an event in Miami where I shared this data visualization, and we held a dialogue about collaborative solutions.

With a team of undergraduate students at this Research Experience for Undergraduates (REU) program at the University of Maryland, Baltimore County, we researched methods to apply symbolic regression, a type of machine learning, to estimate rainfall rate from radar data. We presented our poster at the 2024 American Geophysical Union Annual Meeting and our paper at the 2024 IEEE International Conference on Big Data.
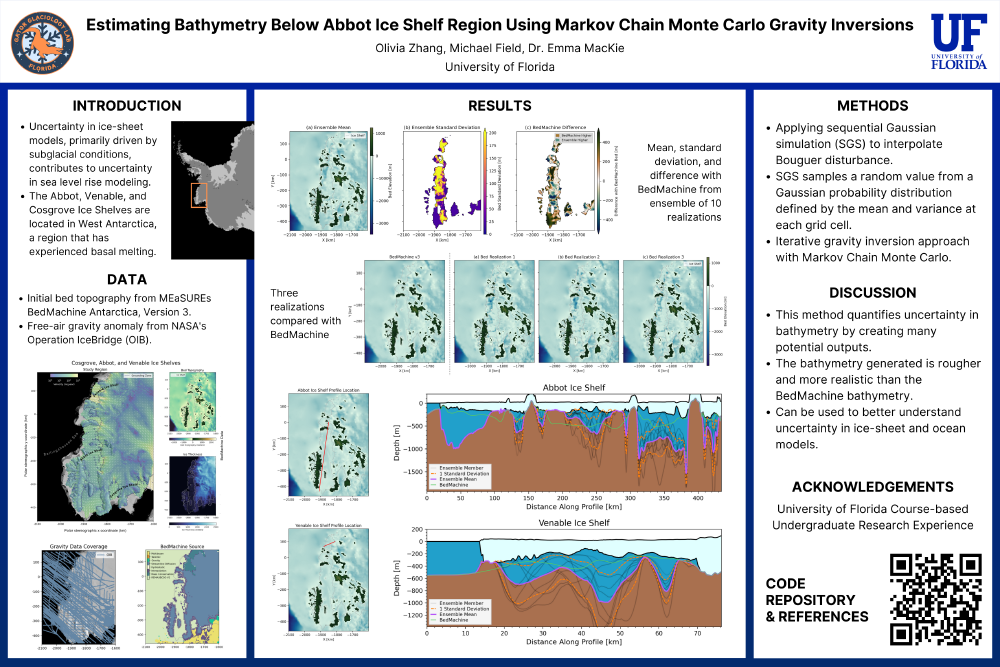
As part of a research-based class, we applied Markov Chain Monte Carlo gravity inversions using Python to quantify uncertainty in the seafloor beneath ice shelves in Antarctica, creating multiple, more realistic realizations of the bathymetry.
I created this Story Map about inactive voters based on our analysis of Florida voter files since 2016 and presented our research at the 2024 Election Science, Reform, and Administration Conference. [Election Lab at the University of Florida]
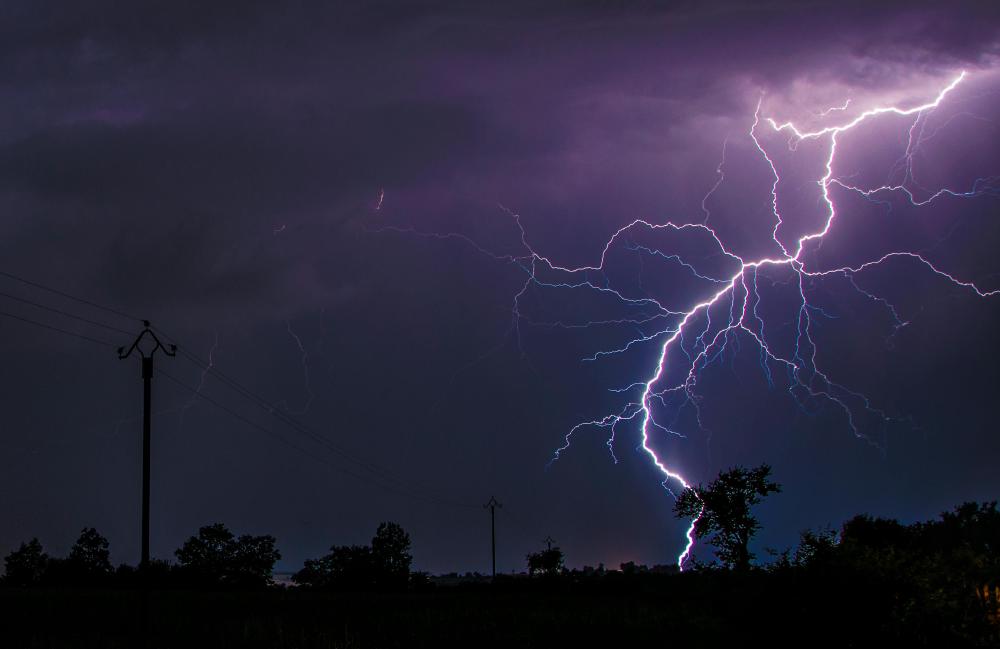
With Fire Neural Network, I wrote this ArcGIS Story Map to give an overview of lightning-caused wildfires that occurred in Florida in 2023.
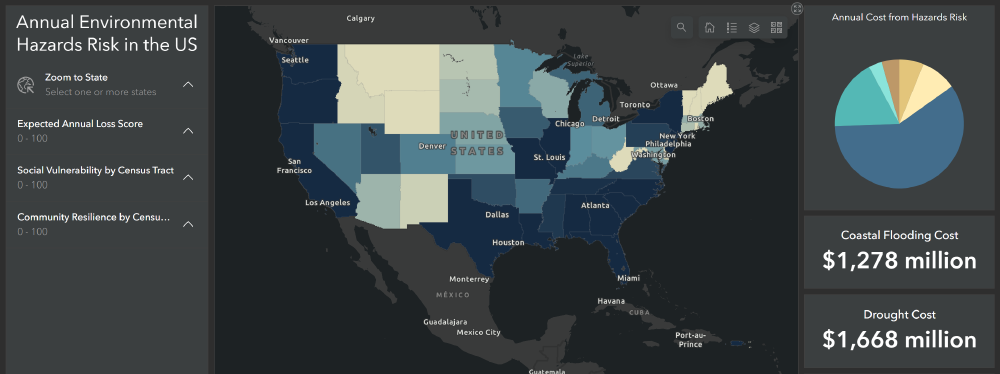
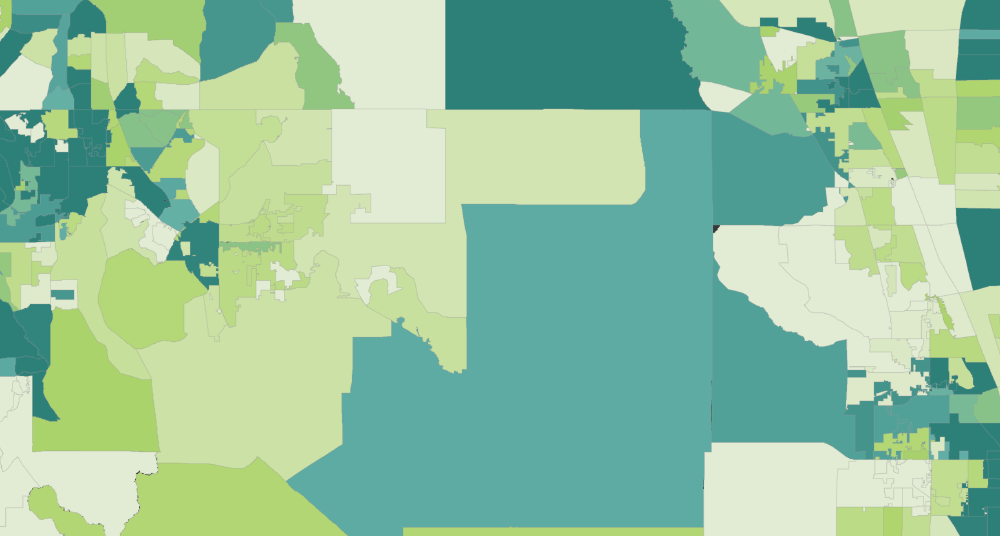
This dashboard explores the Expected Annual Loss across the US from various natural hazards, with data from the FEMA National Risk Index by State (zoomed out) and Census Tract (zoomed in).
Research lab (led by Dr. Chang Zhao) studying where and how nature provides benefits to communities.
• Developing workflow to standardize data about urban farms and community gardens from various sources.
• Processing high-resolution imagery from the National Agriculture Imagery Program to analyze urban agriculture sites.
Research lab (led by Dr. Di Yang) studying human-environment interactions with remote sensing, geospatial AI, and citizen science.
• Creating tutorials explaining how to analyze citizen science data with Python and Google Earth Engine.
• Developed interactive dashboard visualizing citizen science data about mosquito habitats, designed to raise awareness and encourage more participation in open-source data collection for NASA GLOBE.
Fire Neural Network gives firefighters timely alerts about lightning strikes likely to cause wildfires - through a combination of AI, drones, and GIS mapping.
• Built interactive dashboards with lightning and fire data in ArcGIS Online, used by stakeholders to identify dangerous lightning likely to ignite wildfires.
• Created videos demonstrating each dashboard’s features.
• Analyzed 500+ satellite images to locate burned areas from lightning-caused wildfires, helping train machine learning model.
trubel&co is a nonprofit that hosts educational programs for youth about using data, design, and technology for social justice.
• Planned curriculum and coordinated Data Storytelling for Environmental Action, 3-week program for 50+ young professionals teaching GIS and data analysis.
• Helped coordinate Mapping Justice: Gulf Coast, a summer program teaching high school students how to leverage GIS, data, and design to address environmental issues.
• Developed repository of publicly-available spatial datasets for students to use for GIS projects.
Research lab (led by Dr. Nicolas Gauthier) applying AI to the study of biodiversity and cultural history.
• Fine-tuned open-source object detection models in Python to identify archaeological sites in aerial photographs and LiDAR-derived digital elevation models.
• Tested k-means clustering and random forest classification in R to classify islands in Sentinel-2 satellite imagery.
• Prepared training images for machine learning using ArcGIS Pro, Python, and Roboflow.
The GeoPlan Center provides geospatial data, training, and education to support land use, transportation, and environmental planning in Florida.
• Cleaning and standardizing data to be featured in the Florida Geographic Data Library, an online library of free geospatial data for Florida.
• Reviewed flooding over 300+ bridges in ArcGIS Pro to support sea level rise mapping.
CDLS grows leaders who solve environmental problems and create pathways to sustainability.
• Planned curriculum for GIS for Community Health, a program teaching community health promoters and recent graduates how to map issues impacting their communities using QGIS.
NSF-funded Research Experience for Undergraduates program, Online Interdisciplinary Big Data Analytics in Science and Engineering
• Developed workflow incorporating regression and clustering in Python to improve estimates of rainfall rate from weather radar data, improving accuracy and generating interpretable equations.
• Organized code in UMBC’s high-performance computing cluster.
• Collaborated with multidisciplinary team to write research paper, published in 2024 IEEE International Conference on Big Data.
Expected: 2027 Bachelor of Science with double major in Geography and Data ScienceTaken Courses:
Extracurricular Activities:
| ||
Associate of ArtsAbout:Received an Associate of Arts degree from Broward College at the same time as my high school diploma through an accelerated dual-enrollment program. |
Improved skills in deep learning in Python, including data augmentation, transfer learning, and training neural networks using PyTorch.
Completed course about data processing, machine learning, and deep learning in Python; collaborated with another student to apply time series models in Python to forecast global temperature changes, which we presented at AI4ALL’s symposium.
Completed 6-week training about how to apply ArcGIS to understand climate impacts and tell stories from data.
Completed 6-week trianing about preparing spatial data through data engineering methods, processing data (suitability analysis, predictive modeling, and object detection), and communicating results in engaging ways using ArcGIS tools.